Product tour
Your first month with Finla.
From connecting the books to walking into the board meeting: six chapters, told with the real product. Five minutes, no form.
- 01Connect
- 02See the business
- 03Teach it your plan
- 04Month-end
- 05The miss, explained
- 06Publish
Connected before lunch.
Choose QuickBooks or NetSuite, approve access, and Finla starts reading your books. No implementation project, no CSV ritual.
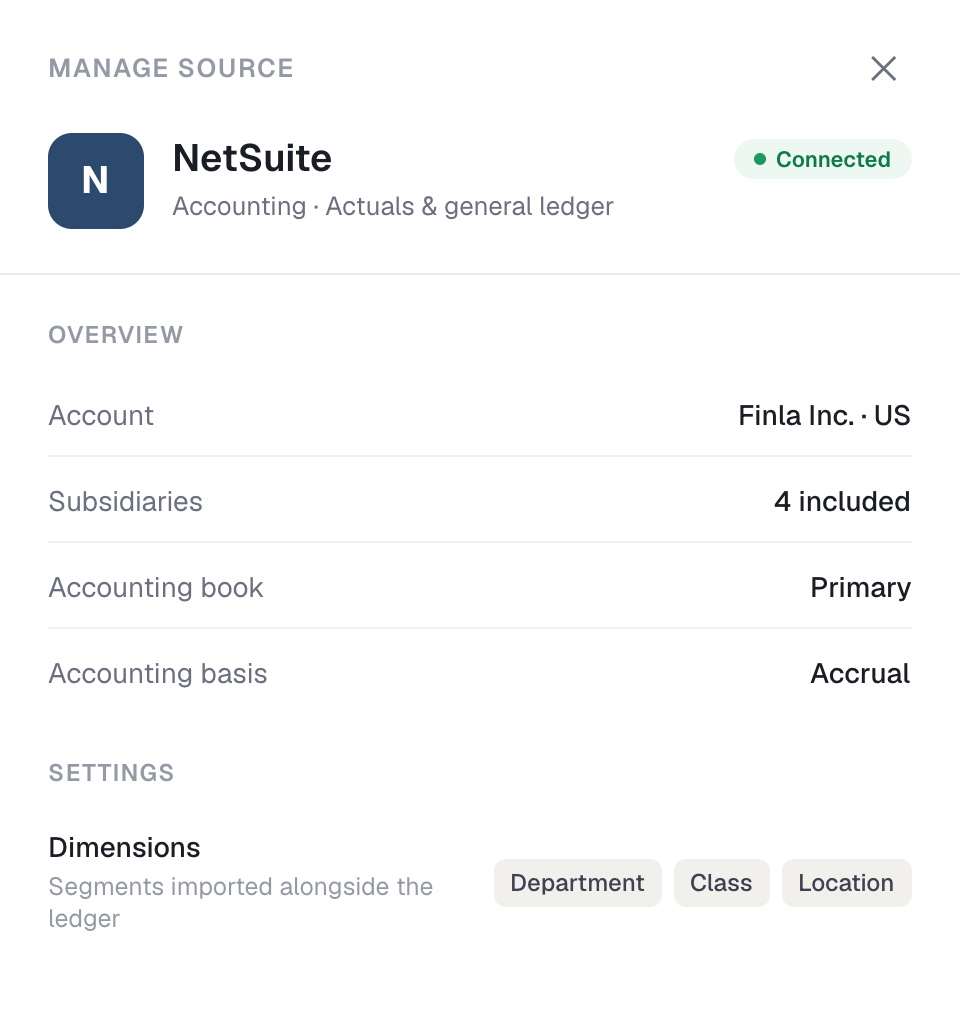
Finance owns the connection
Sync schedule, scope, and status live in one panel your team controls. Finla reads your books; it never writes back.
You already understand the business.
Cash position, burn, runway, and the trough ahead, each labeled with the basis behind it. This is the afternoon of day one, not week six.
Teach it your plan.
Drop in the budget workbook you already keep. Finla finds the right tab, reads the structure, and maps it to your accounts for your review.
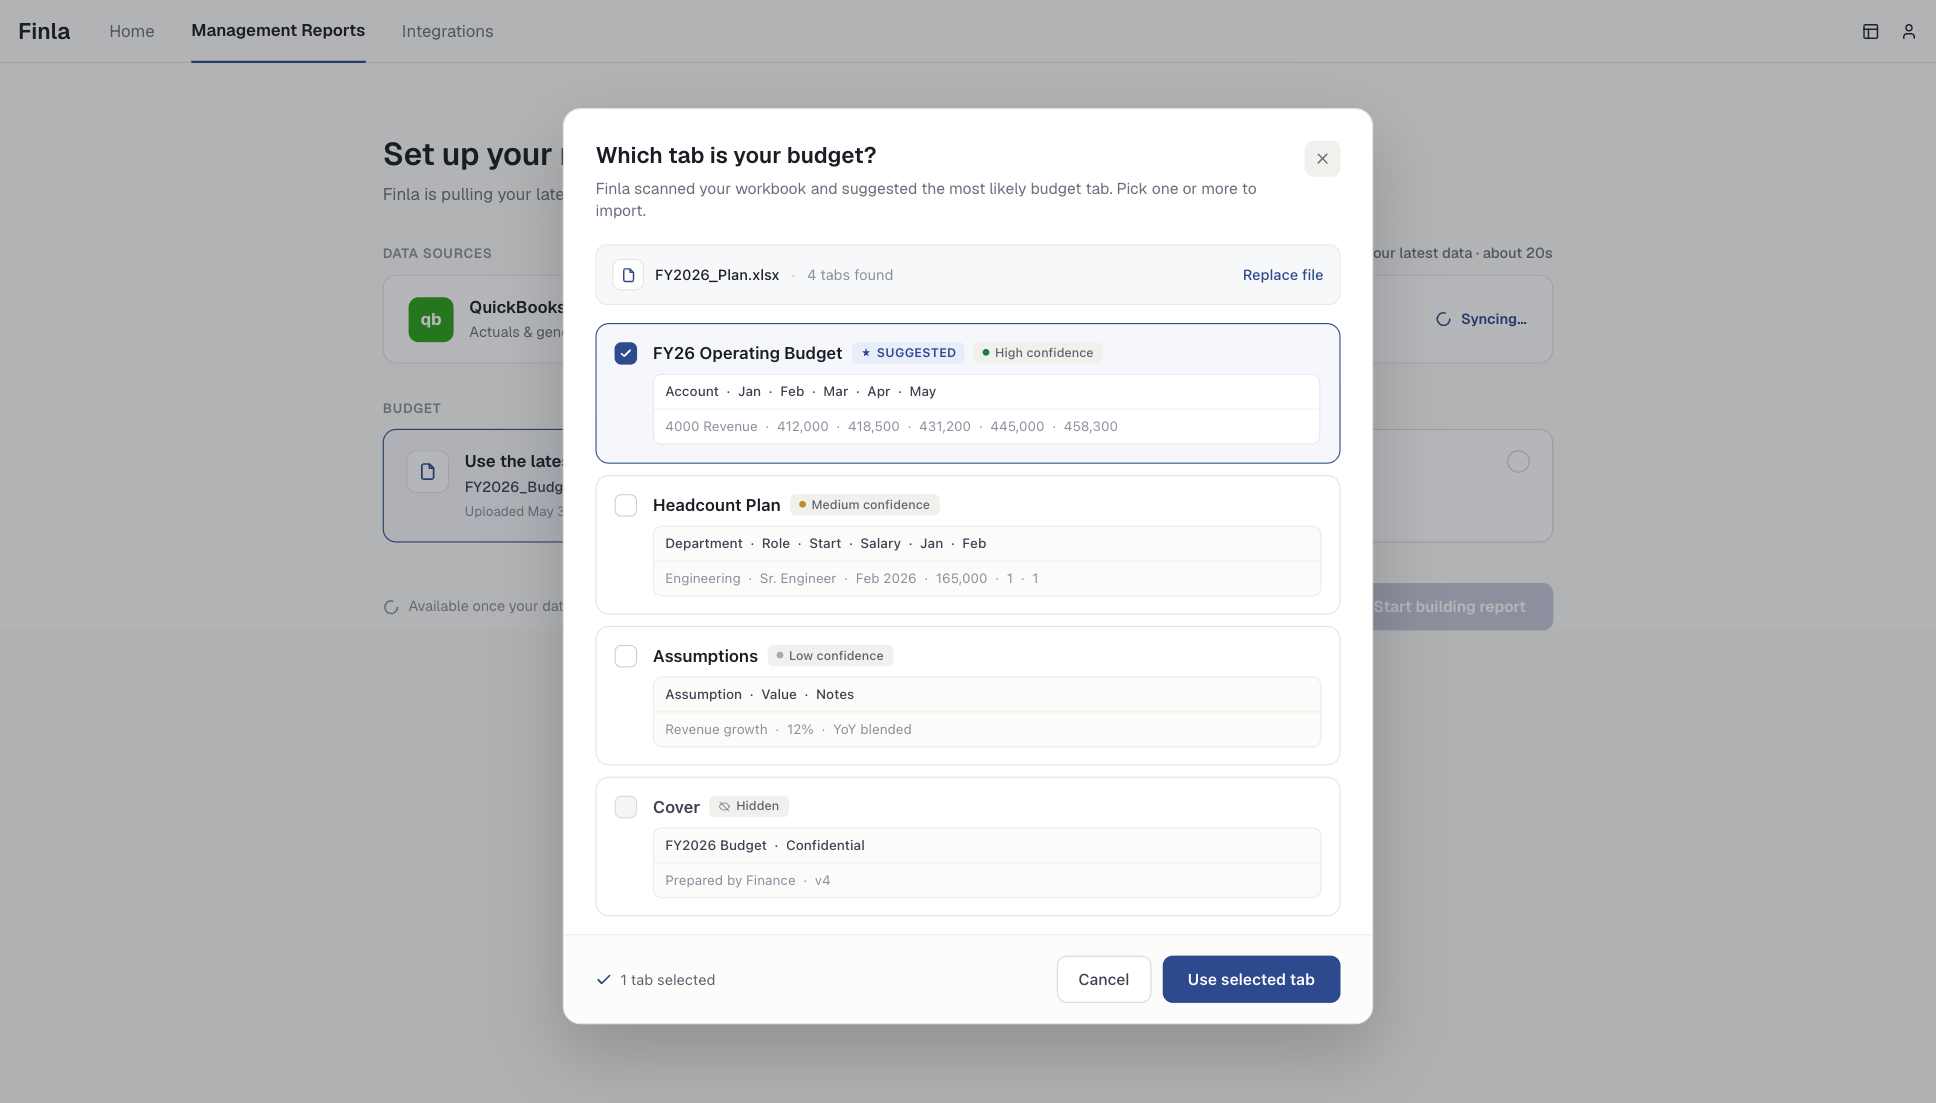
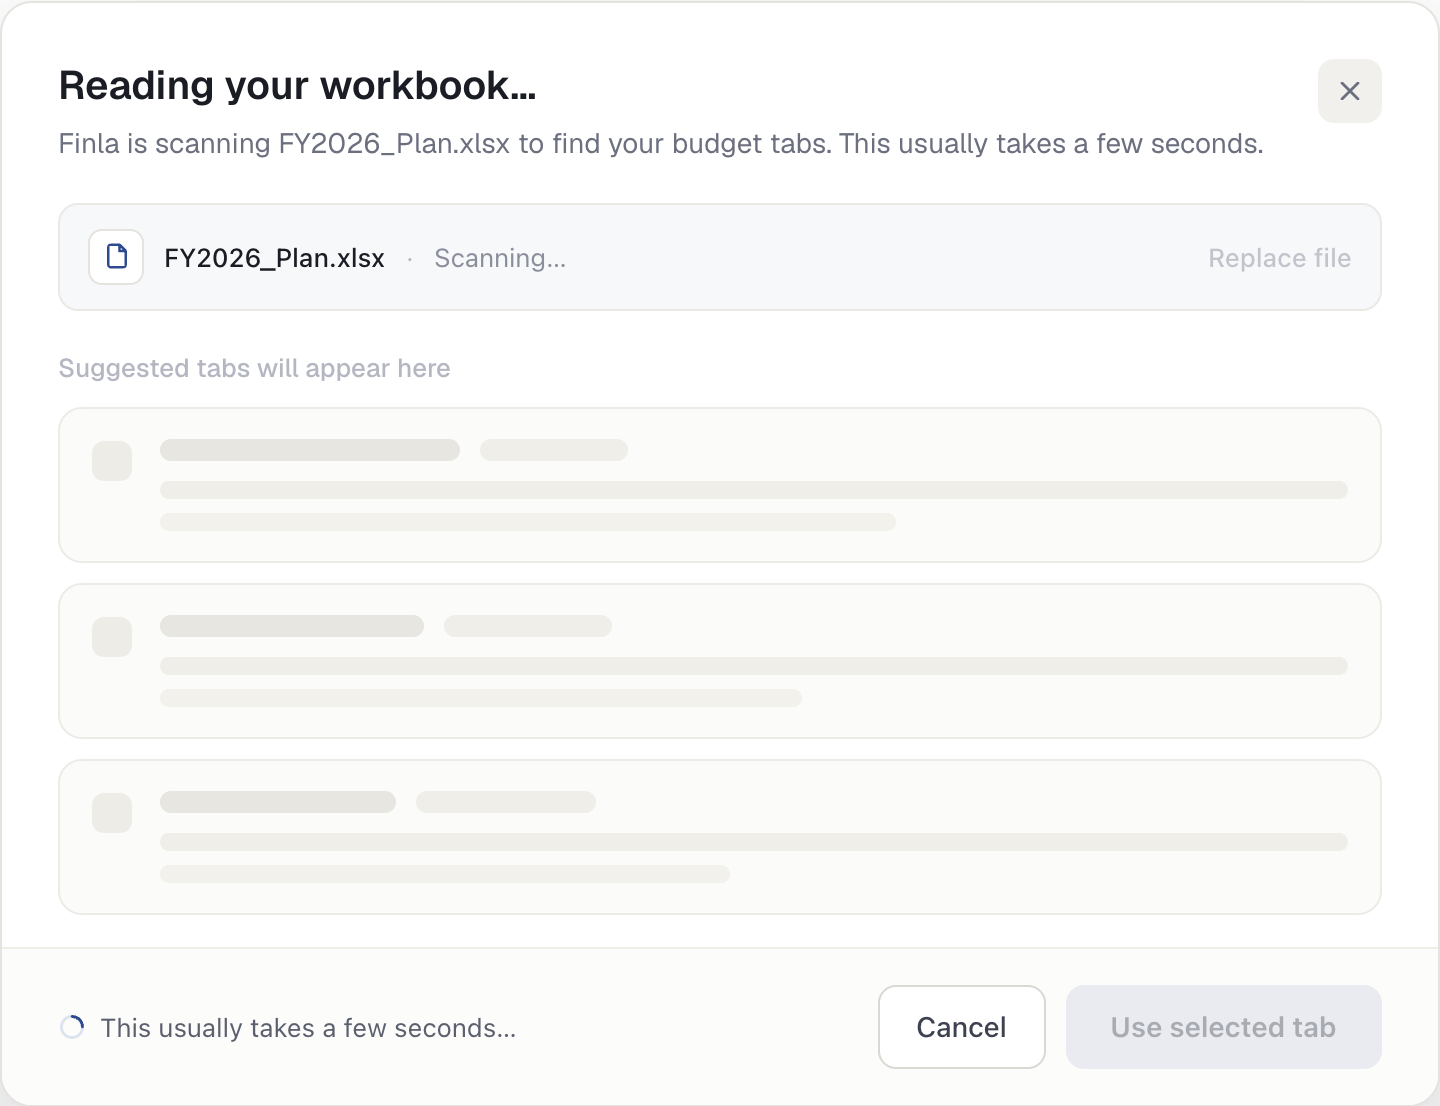
Messy tabs welcome
Finla scans the workbook, proposes the mapping, and shows its confidence. You confirm before anything counts.
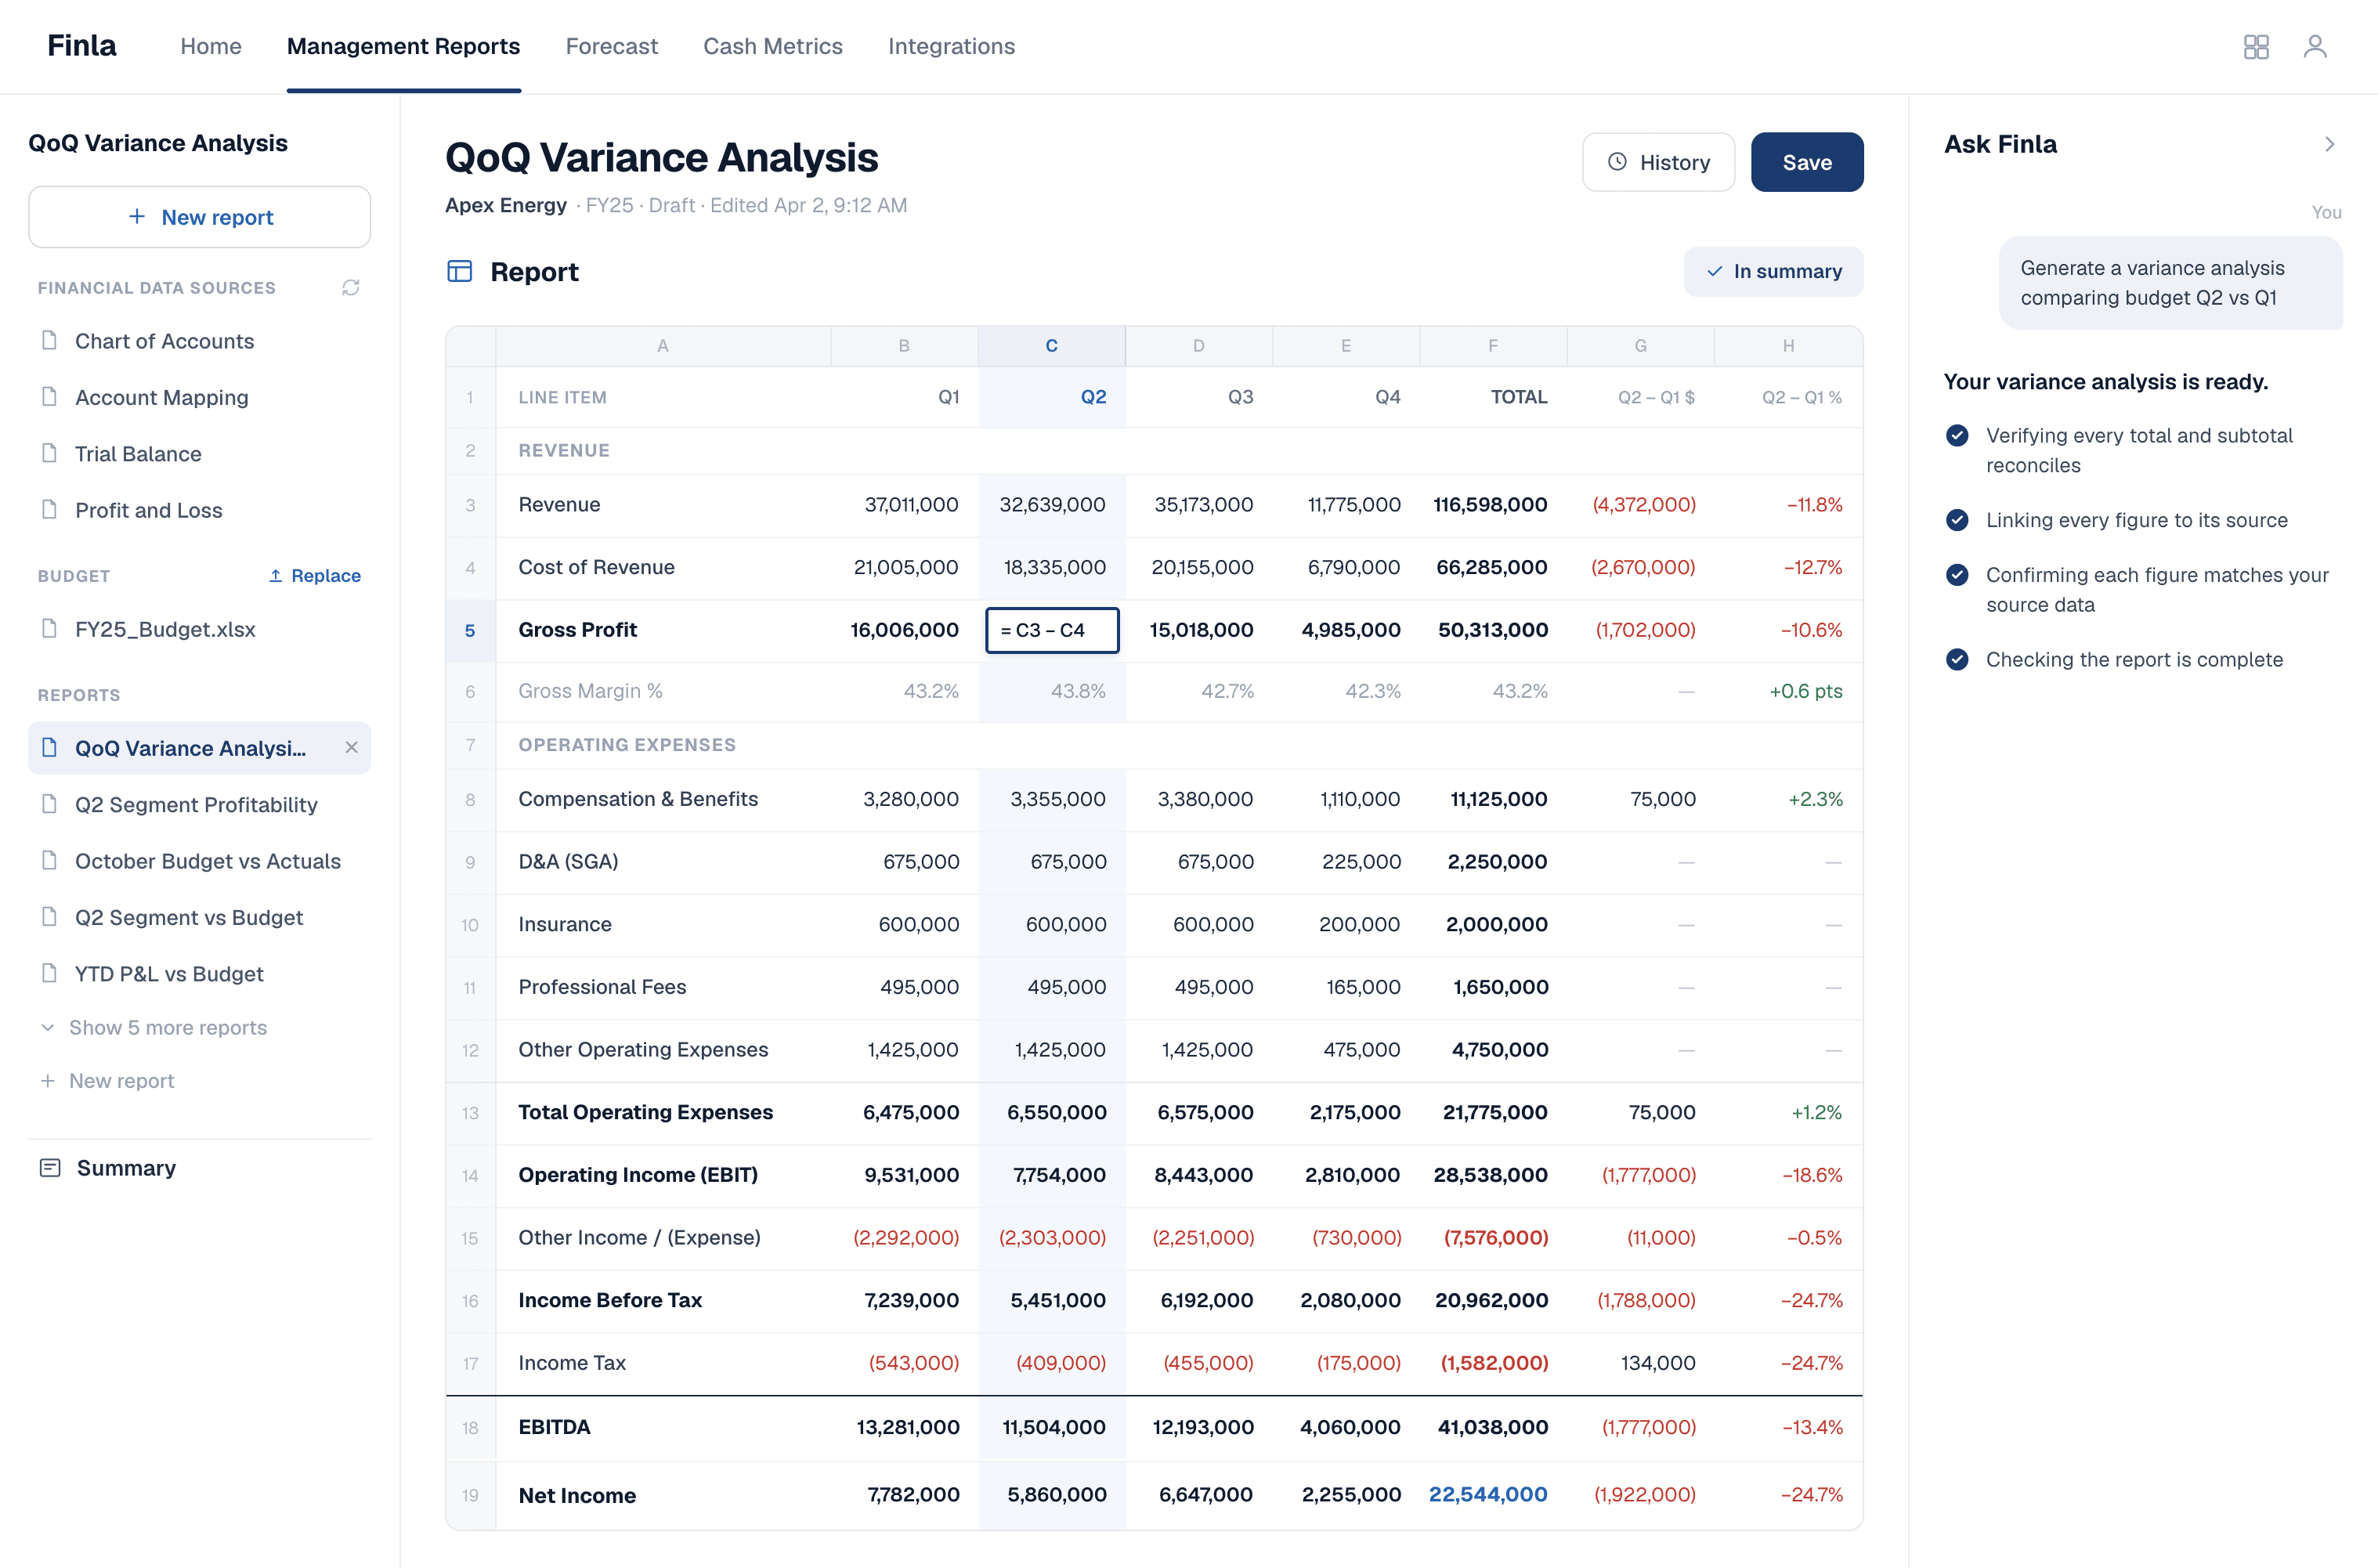
The report assembles itself.
Statements, variance tables, and commentary draft together while Finla checks its own work. Totals reconcile. Every figure links to its source.
Commentary included
The key takeaway and drivers draft alongside the tables, and every sentence carries citations back to the figures it describes. You edit; it stays yours.
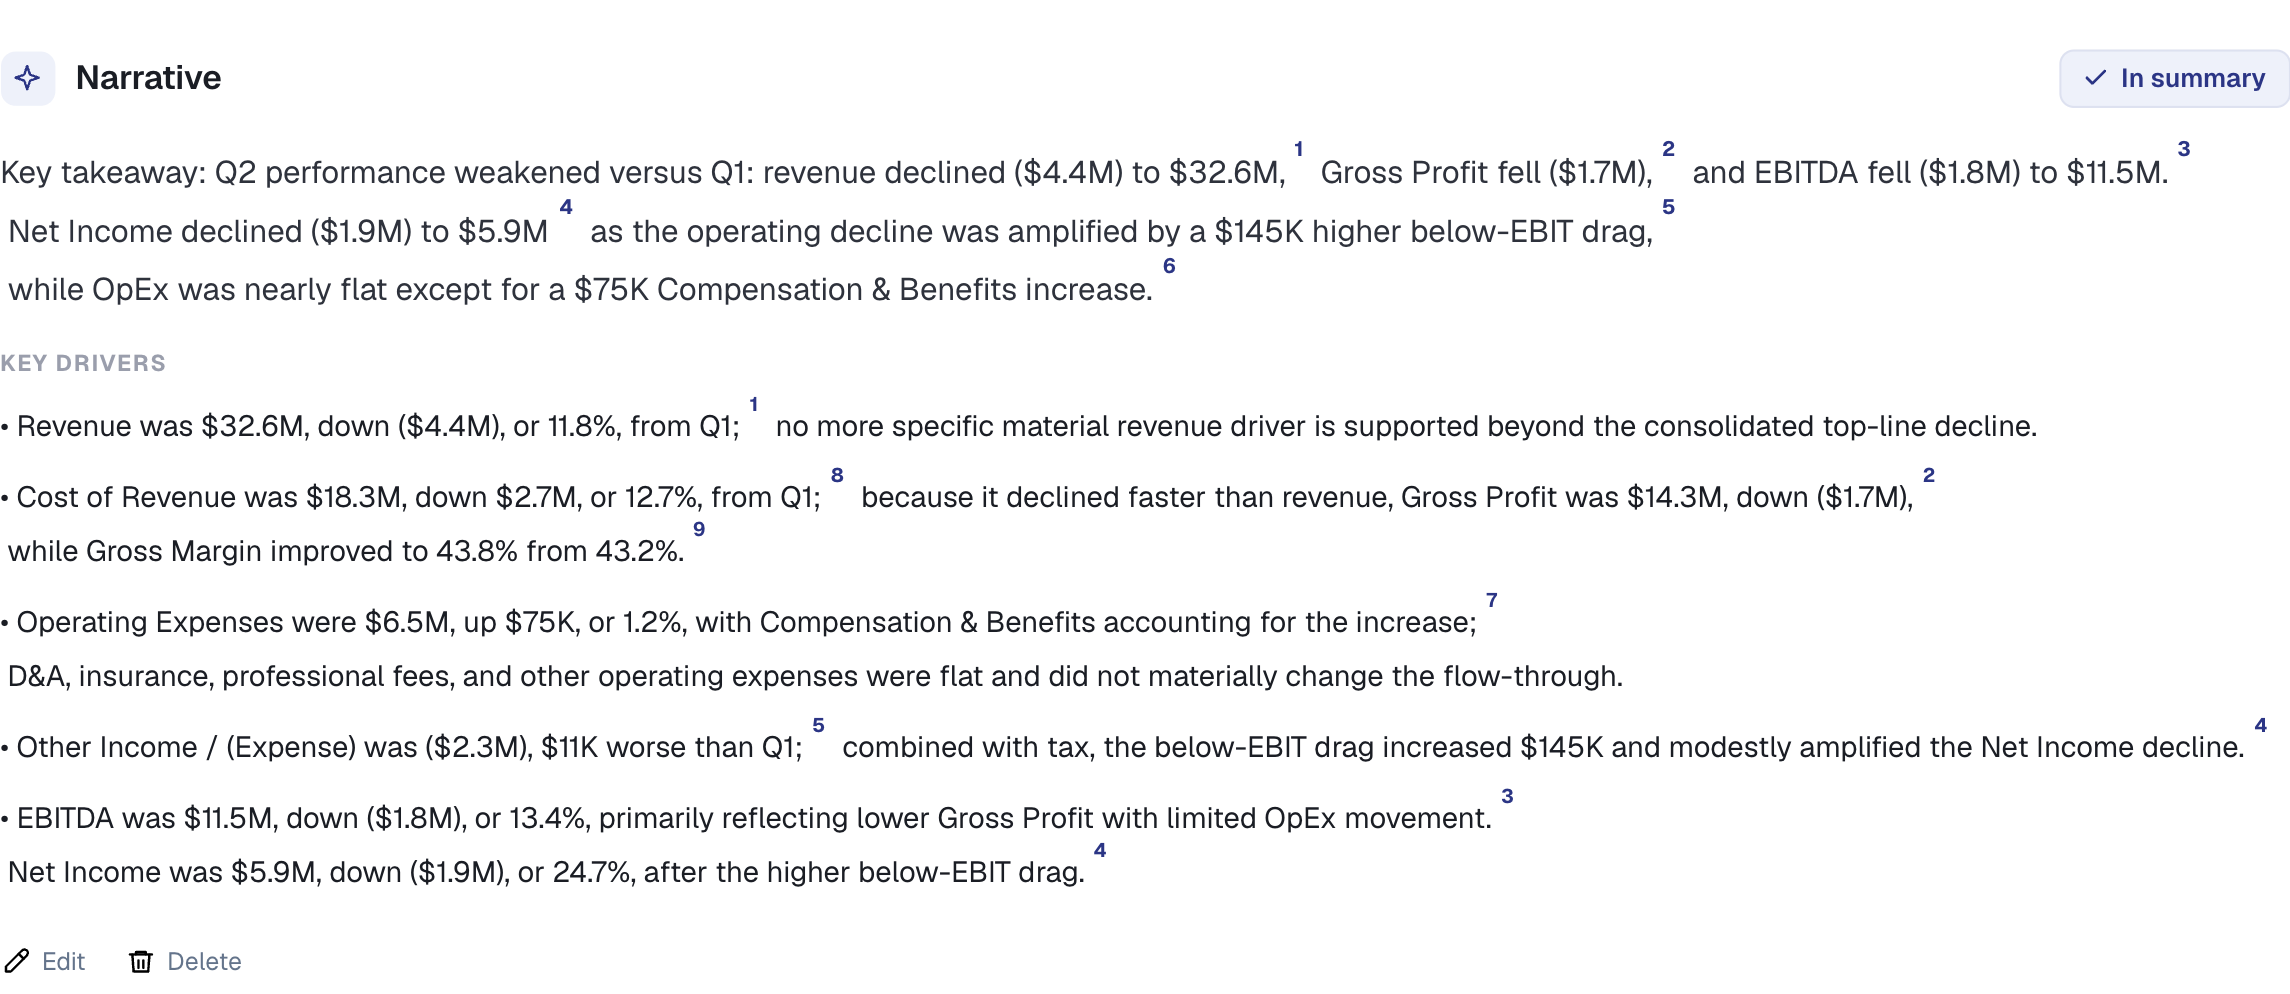
Follow one number: the $418K miss.
Revenue came in $418K below forecast. Here's how that one number gets explained, traced to its source, and signed off without leaving Finla.
01The bridge names the drivers: two enterprise deals slipped to Q2, and win rate softened.
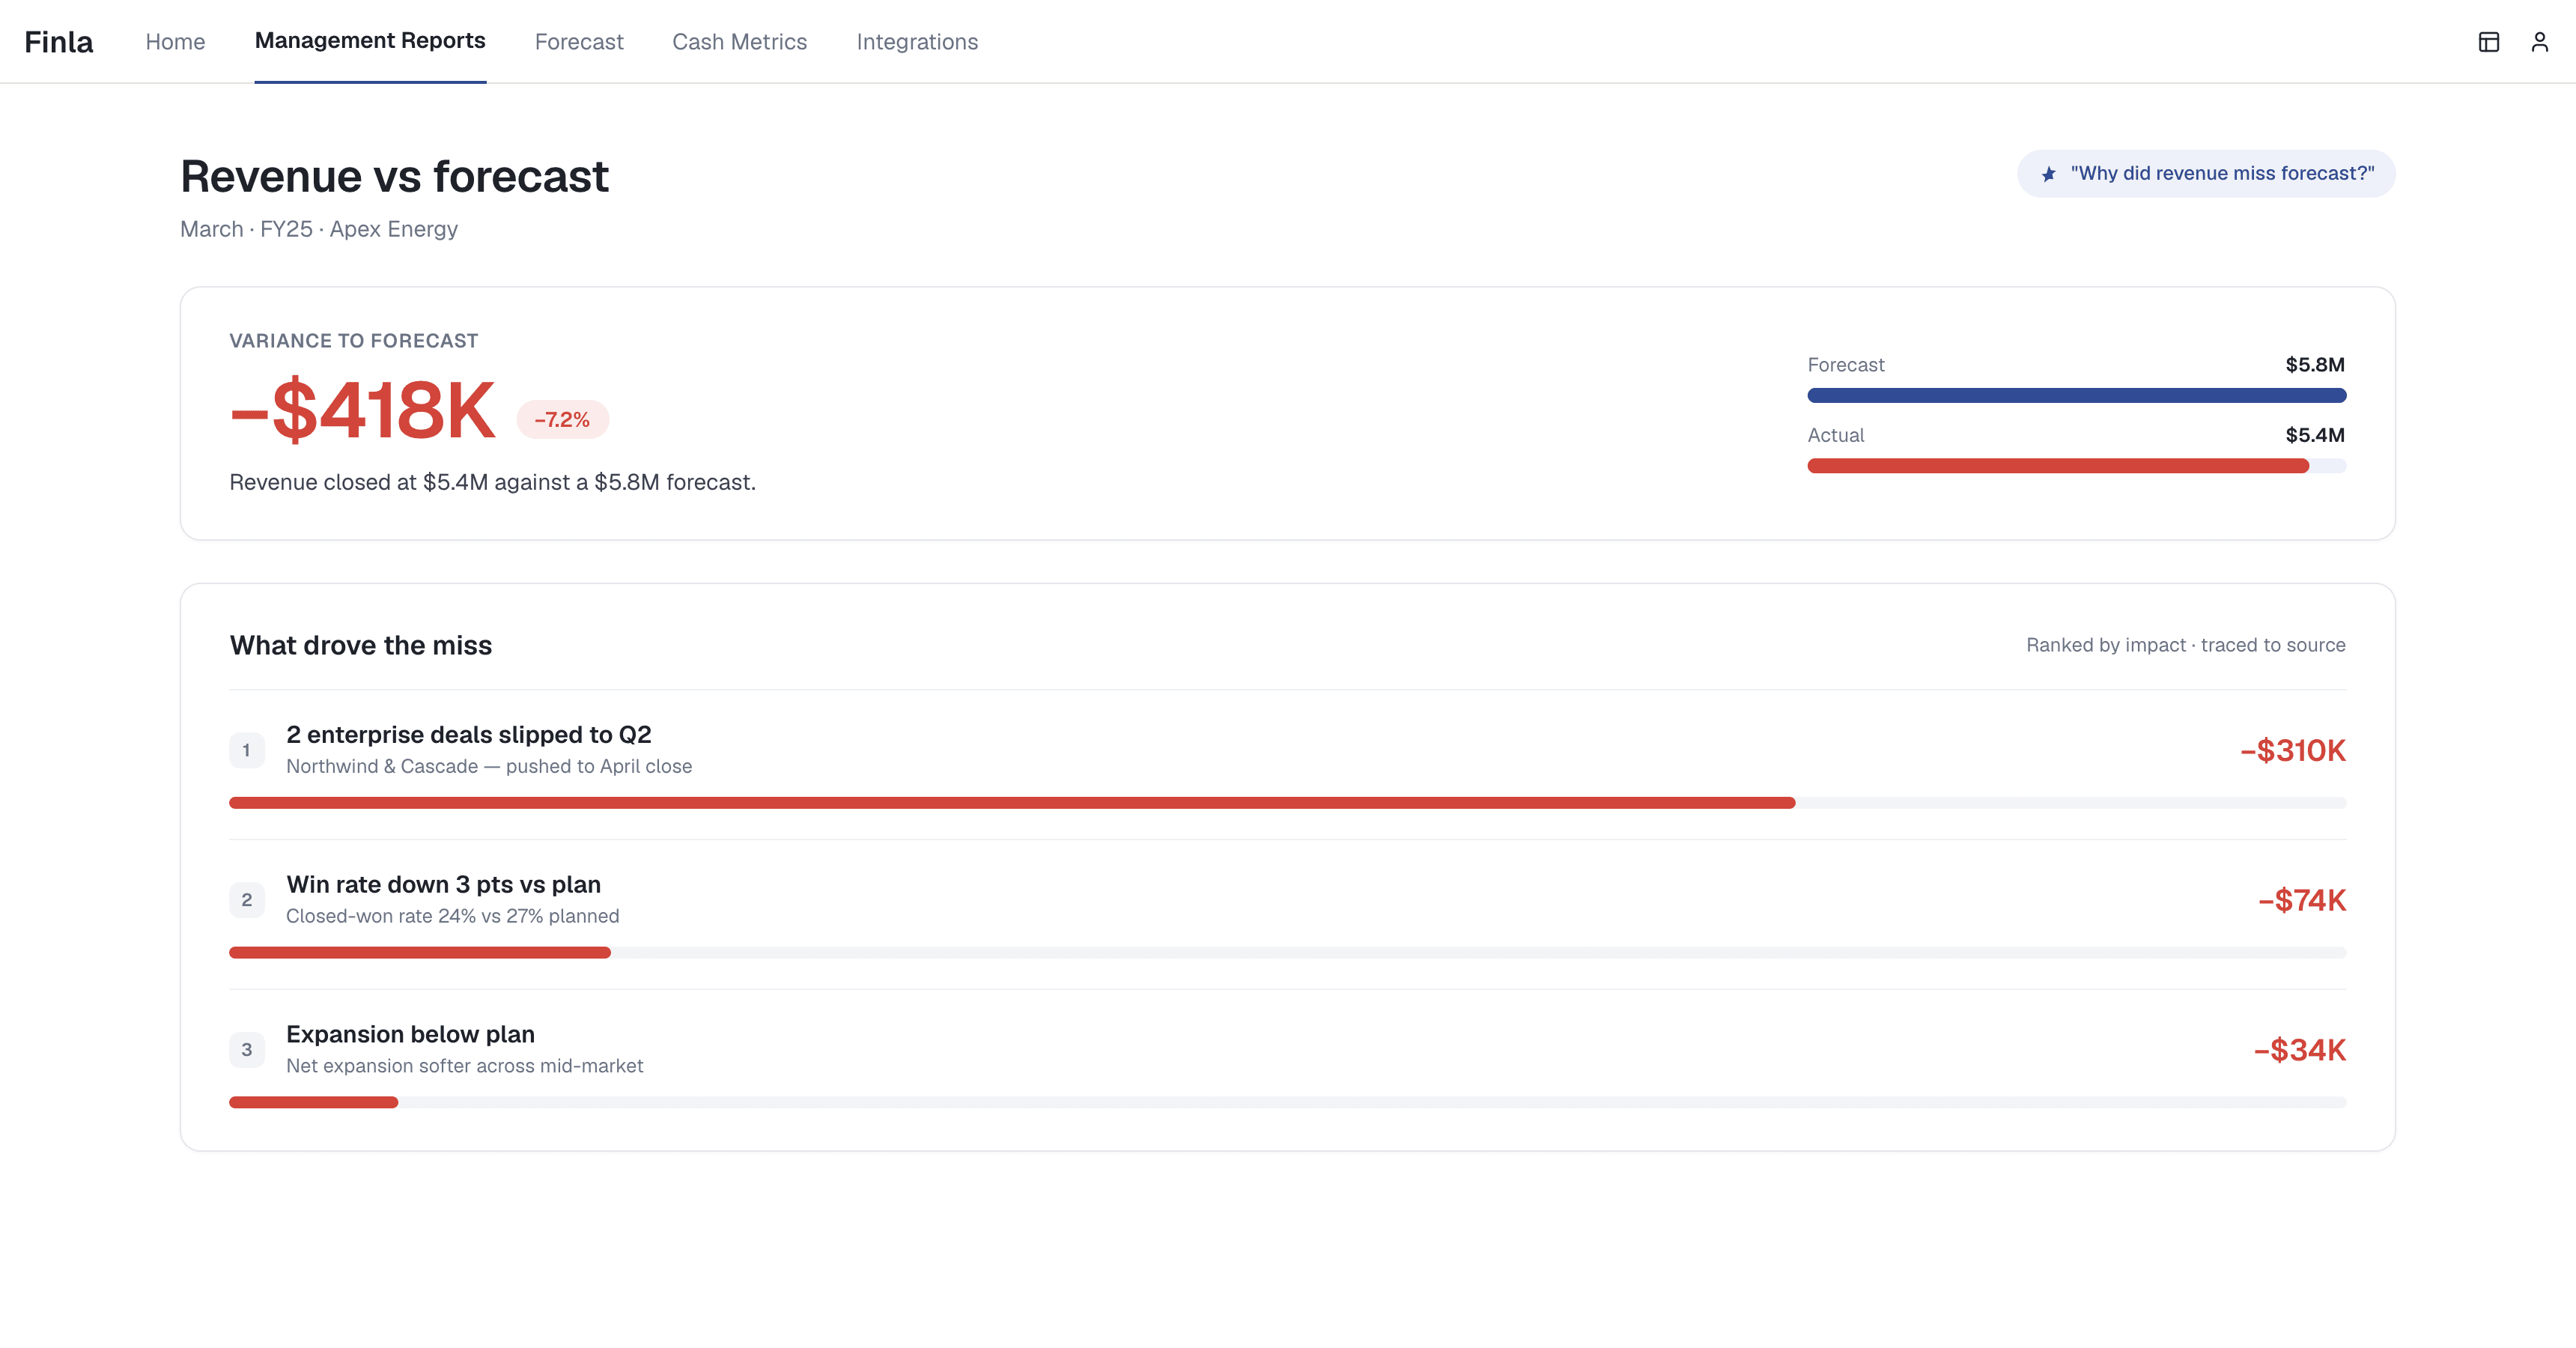
02The narrative cites them in place. Each tag opens the source: the metric, the statement cells behind it, and when it synced.
Revenue came in at $5.4M, $418K below forecast P&L · Mar, driven primarily by two enterprise deals slipping to Q2 Pipeline (−$310K).
Win rate softened to 24% CRM · Q1, accounting for a further −$74K. Runway holds at 18 months Cash.
Approve it, publish it, present it.
Nothing ships until finance signs off. Then the same reviewed context becomes the board deck.
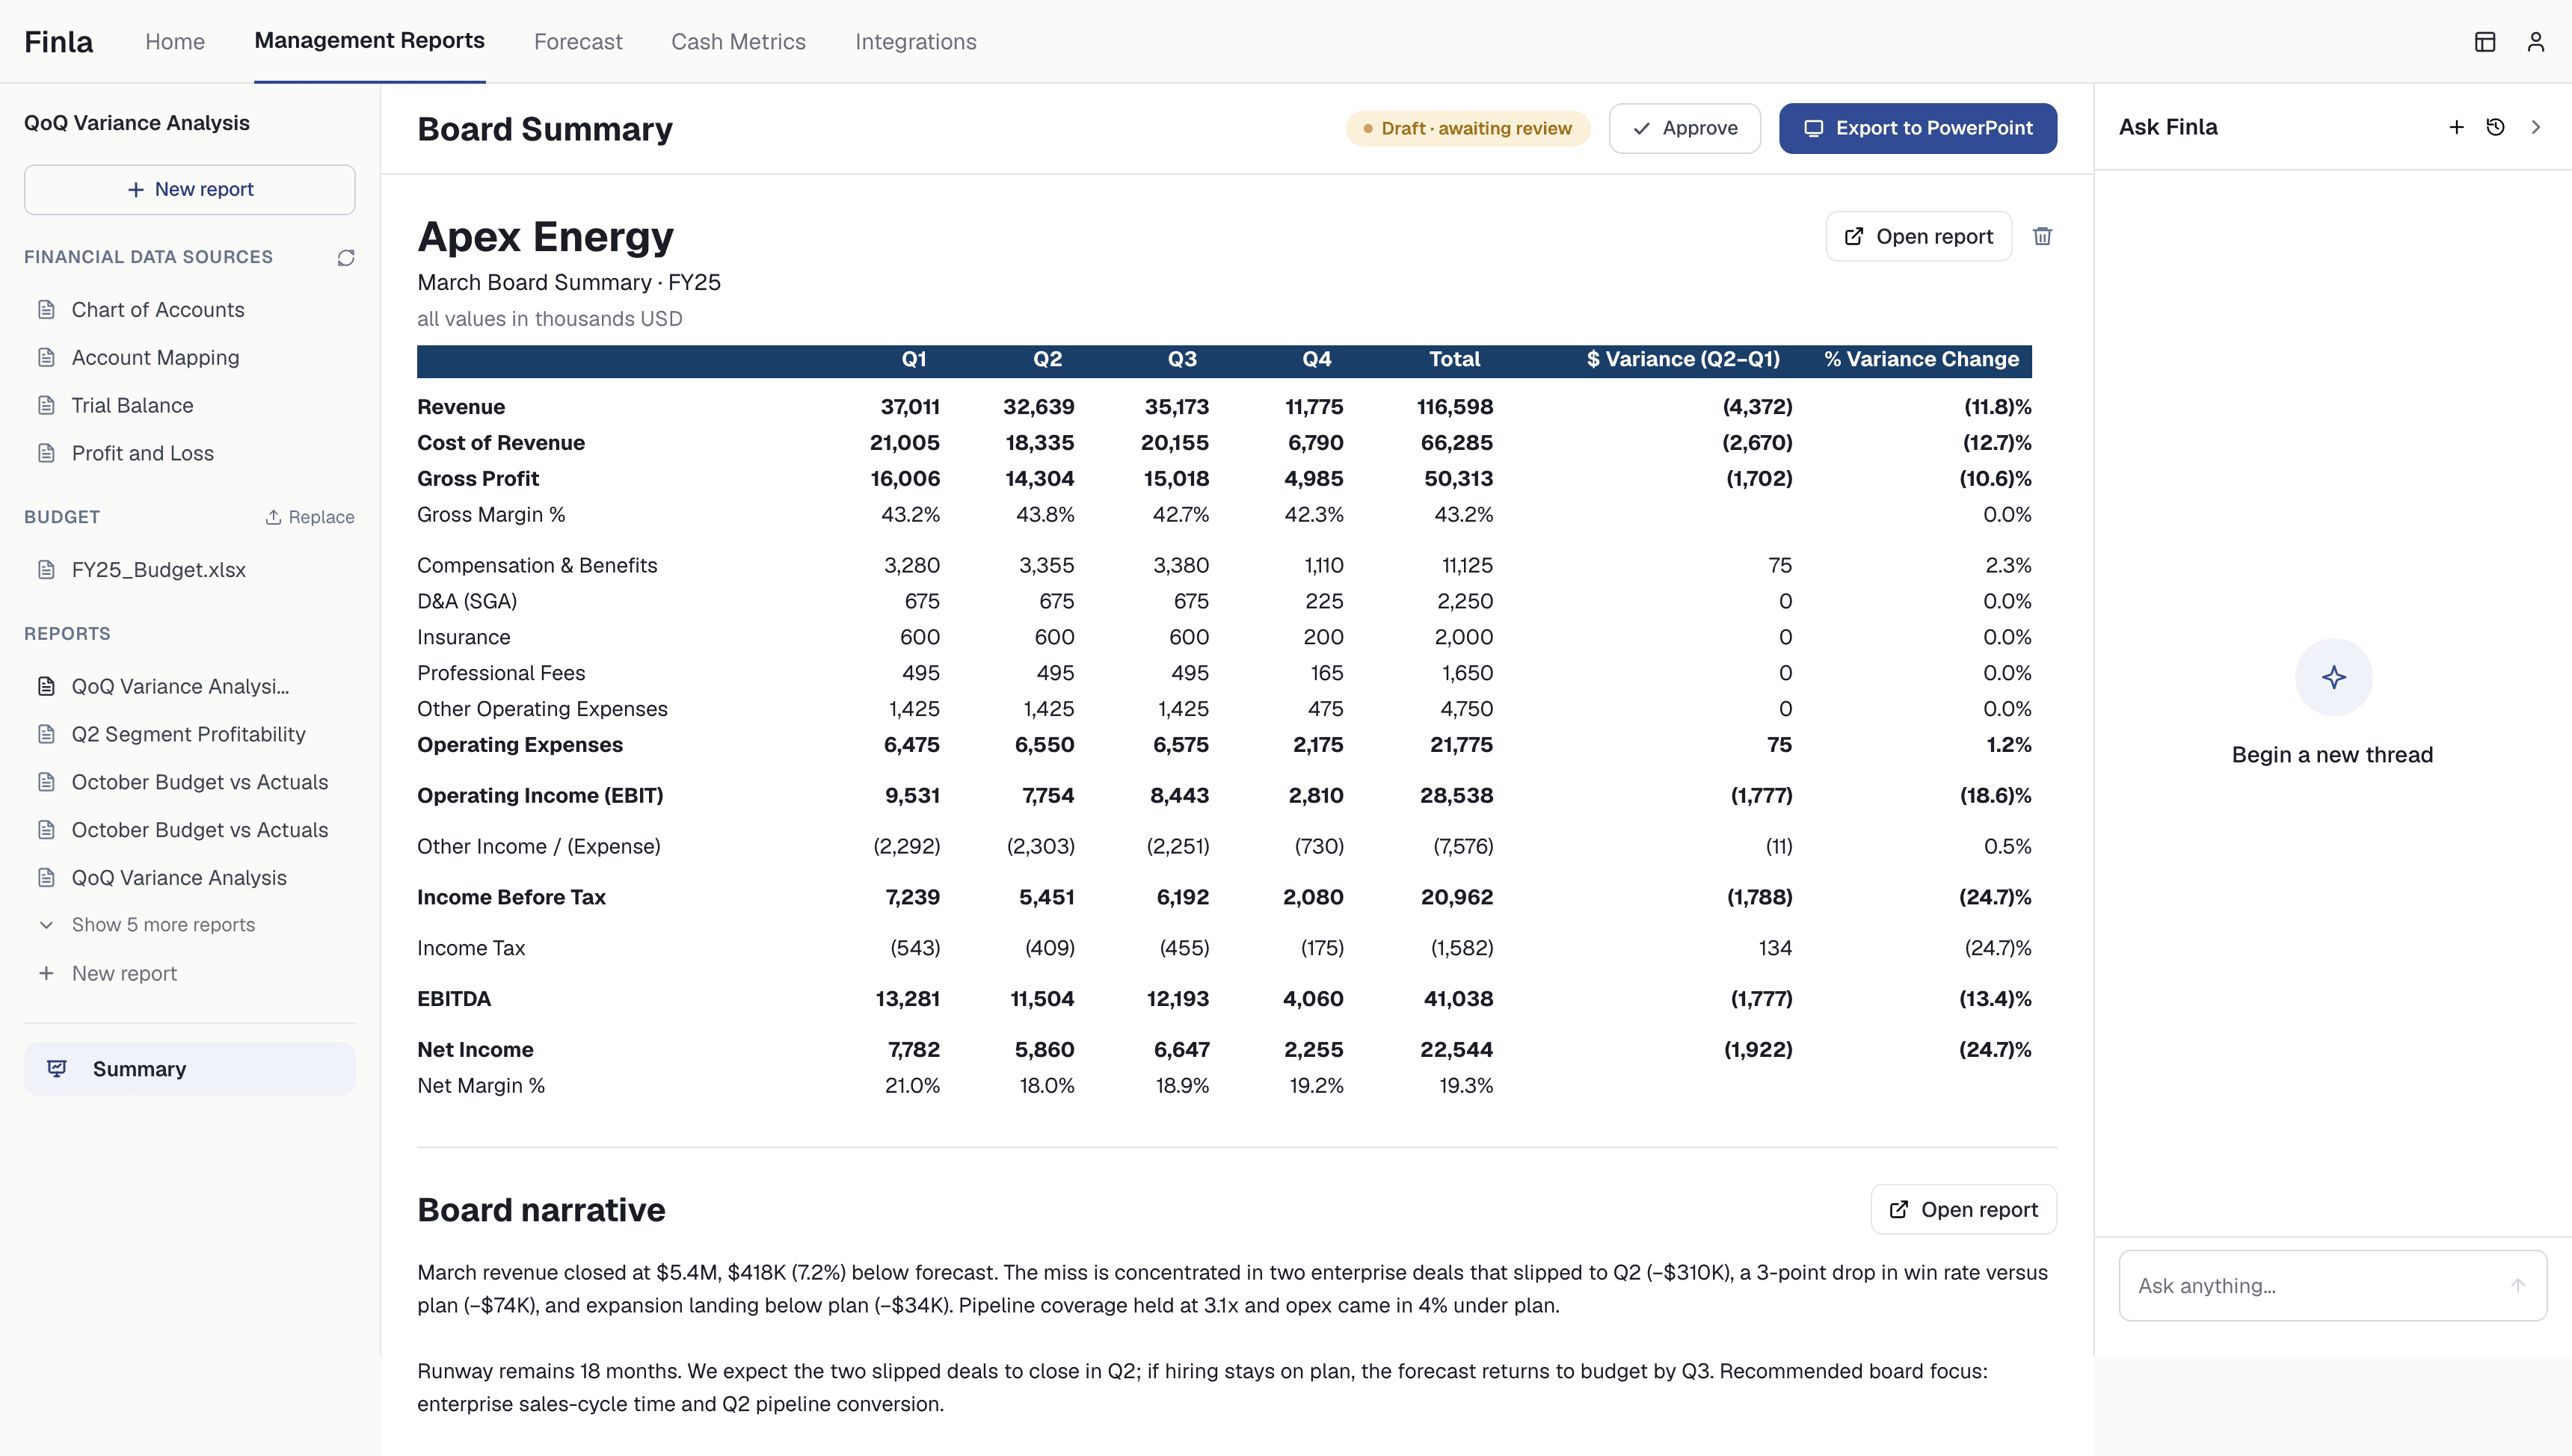
Approval is explicit
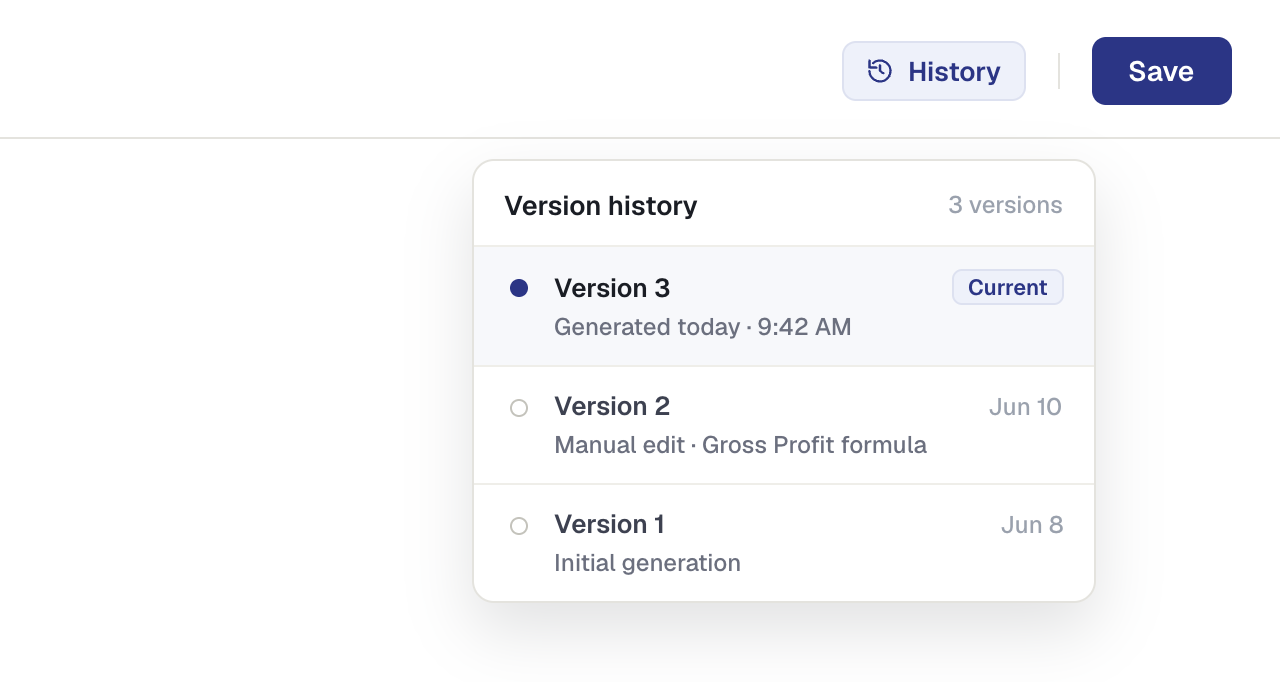
Every version is kept and any prior draft is one click away. The deck exports from the approved report, not from a side file.
After the meeting, a follow-up lands in Teams. The answer comes from the same reviewed context. That's the whole point.
Run this month on your numbers.
The tour used our demo company. Book a demo and see the same first month on your books.